Regionality & complexity

This post follows on in part from a post I wrote a couple of years ago on regionality. It will also begin with an apology: the maps presented here will be very difficult for colour blind readers to understand, for which I am sorry. Unfortunately, the technique involved is somewhat limited in terms of control of colour (as it requires three colour channels), so it is not possible (or at least very difficult) to improve the maps to make them more legible for colour blind readers. As such, I would not propose publishing these particular visualisations in any formal setting, but hopefully I can get away with it in a blog post!

Before we get to the maps themselves, I shall describe briefly the mapping technique involved, which is partly inspired by the work of a former colleague of mine at the University of Leicester, Martin Sterry (departmental webpage; academia.edu). Essentially, this method can be used to describe the relationship between three different spatial variables that can be mapped as density surfaces. First, we create density surfaces (KDE here) for each variable and then we combine them into an RGB image using the Composite Bands tool in ArcGIS, with the first layer forming the red channel, the second layer forming the green channel, and the third layer forming the blue channel. However, RGB images (so-called “additive colours”, which work from black by adding light in the red, green, and blue channels), can be rather dark / muddy, so I then converted the images (using “Invert” in Photoshop) to CMY images instead (so-called “subtractive colours” where one works from white by subtracting light in the cyan, magenta, and yellow channels: this is how colour printers work). To do so cleanly, one must set up one’s map document so that anything one wishes to be white in the final image is black in the map document and vice versa. The same applies to greys, which must be set to their inverse (e.g. a 30R 30G 30B grey as seen below for Wales / Scotland / Man should be set to 225R 225G 225B, being 255-30 in each case). This may sound somewhat complicated but the end result is as follows:

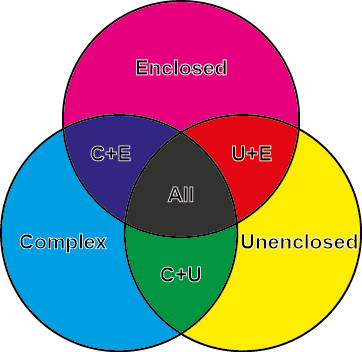
  • Cyan (turquoise) tones represent high values in Channel 1, e.g. “complex farmsteads” in the first example below.
  • Magenta tones represent high values in Channel 2, e.g. “enclosed farmsteads” in the first example below.
  • Yellow tones represent high values in Channel 3, e.g. “unenclosed farmsteads” in the first example below.
  • Blue tones represent high values in Channels 1 and 2.
  • Red tones represent high values in Channels 2 and 3.
  • Green tones represent high values in Channels 1 and 3.
  • Dark grey / black tones represent high values in all three Channels.
  • White or pale tones represent low values in all three Channels.

Here is a close up of the colour category zones for the first two examples below:

2 CMYK_RRSP

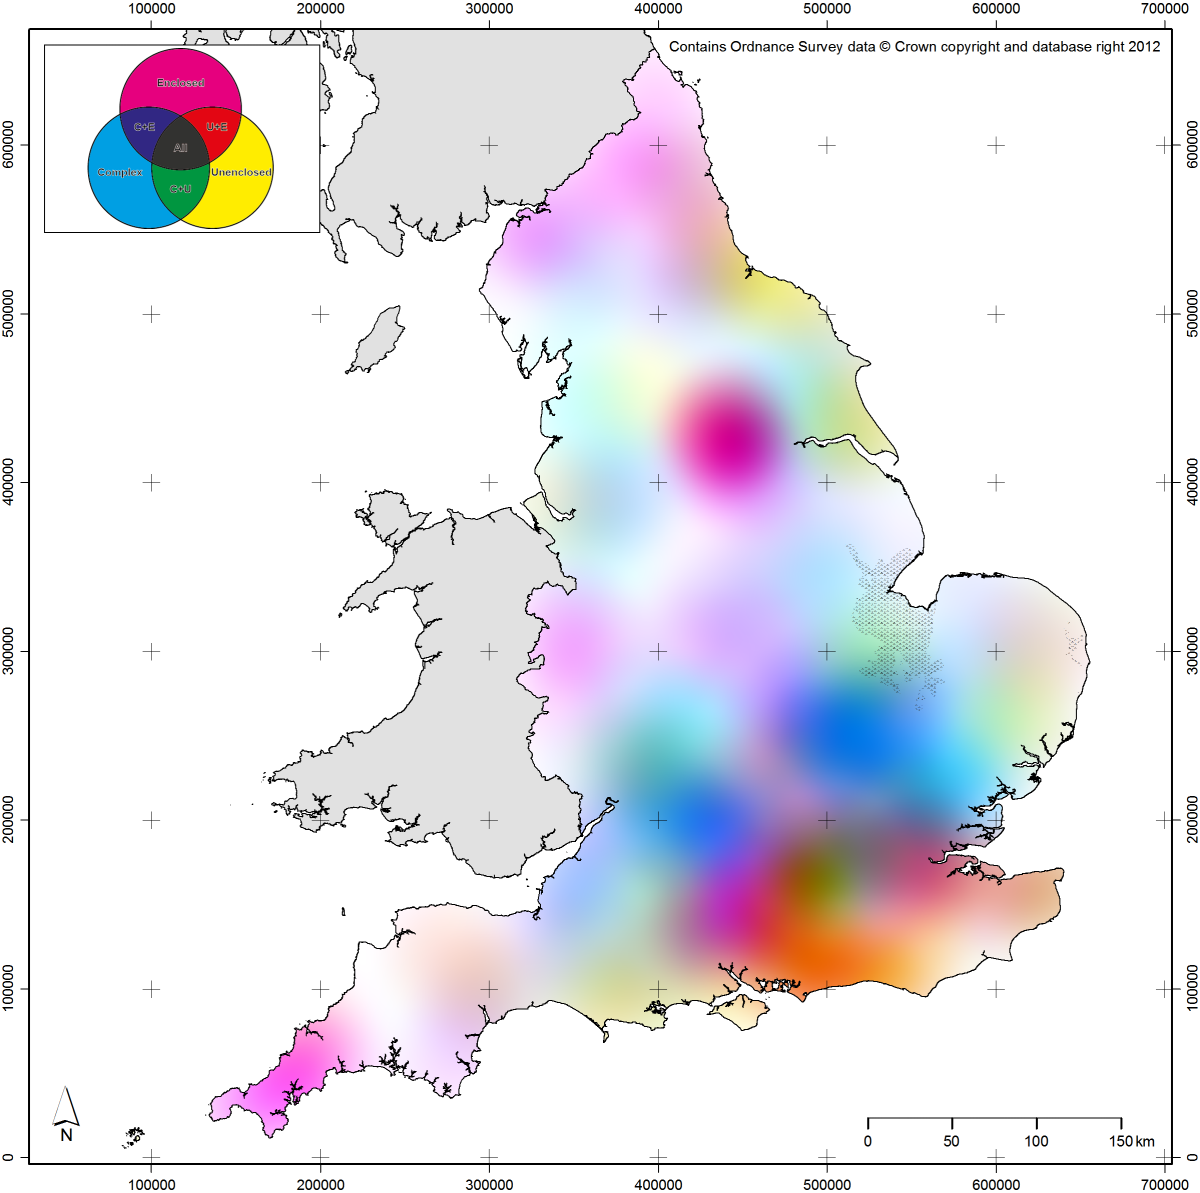
I began by examining the three main categories of Roman farmstead defined by the Roman Rural Settlement Project (RRSP) at Reading, using their excellent data that is available online (Allen et al. 2015). As they defined only three specific categories, this is an ideal dataset to map in this way. For a first attempt, I made three KDE layers using a 10km kernel (or search window) to structure the size of the clusters in the resulting output, then combined them as described above. When plotted against the regions defined based upon variation in their data by the RRSP team (Smith et al. 2016: Chapter 1), we can see that there is a degree of agreement between the regions and the clustering of particular colours:

1 RRSP_psychedelia_v3_inc_regions

However, there is also clearly considerably more complexity to the data than a simple regional classification might suggest (as the RRSP team would certainly acknowledge, so this is not intended as a criticism in any way). If we construct a new model using a wider kernel (in this case 50km), we can get a really nice sense of regional variation in the data without the need to draw lines on a map:

3 RRSP_psychedelia_v2

There is some interesting structure in this model. For example, one can see a focus on enclosed farmsteads in the north and west, so-called complex farmsteads in parts of the southern and eastern midlands (largely alongside enclosed farmsteads), with quite a different focus on enclosed and unenclosed farmsteads in the south east. The strong peak in enclosed farmsteads in south Yorkshire / the north midlands is also quite striking. Although it relies too much on good colour vision in a reader, I think this model and technique works quite well here, so I decided to apply it to another dataset: our own.

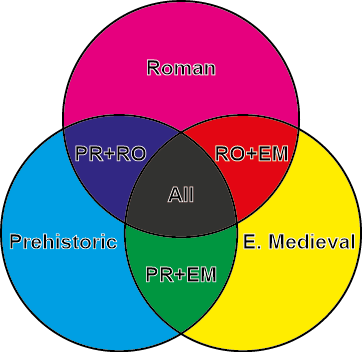
Before we get to the next stage, here is a close-up of the colour category zones for the next two maps (with RO = Roman; PR = Prehistoric; EM = early medieval):

5 CMYK_Englaid

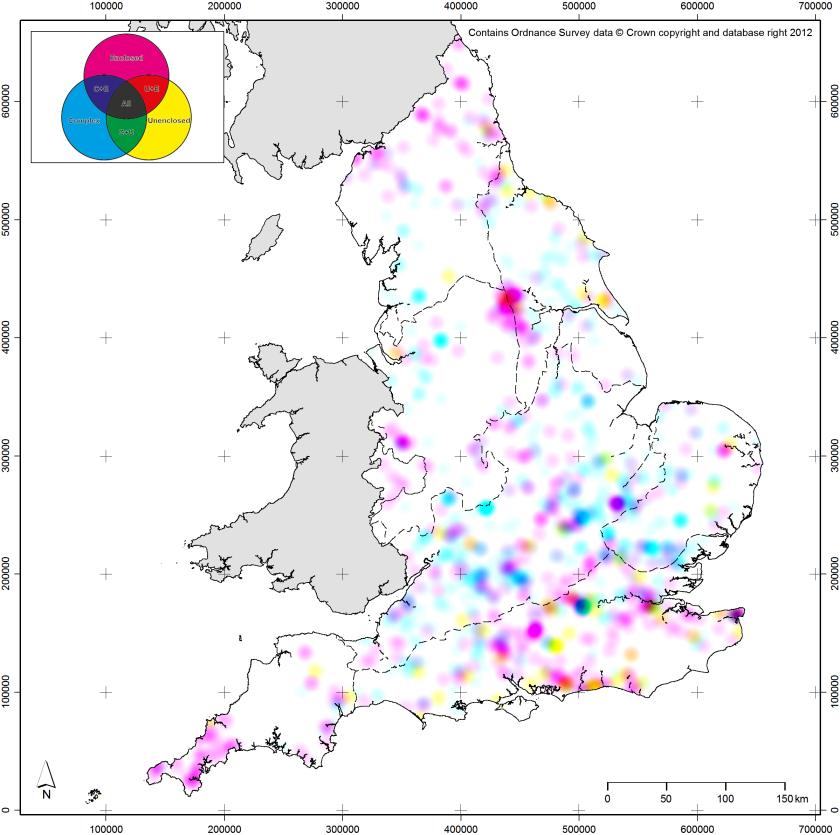
Based on another technique which we published recently (Green et al. 2017), the following two maps are created from a measure of the “complexity” of our datasets: specifically the number of different types of site / monument (based upon our thesaurus of types; see Portal to the Past) per 1x1km square. This measure was calculated for each square for each time period in our database and then density surfaces created for each time period (using a 5km kernel in this instance). A shortcoming of the mapping technique comes into play here: it can only map three categories at once. As such, we had to combine the Bronze Age and Iron Age models into a composite model for later prehistory. The three time period based complexity models were then combined into a single image as previously:

4 complexity_psychedelia_global

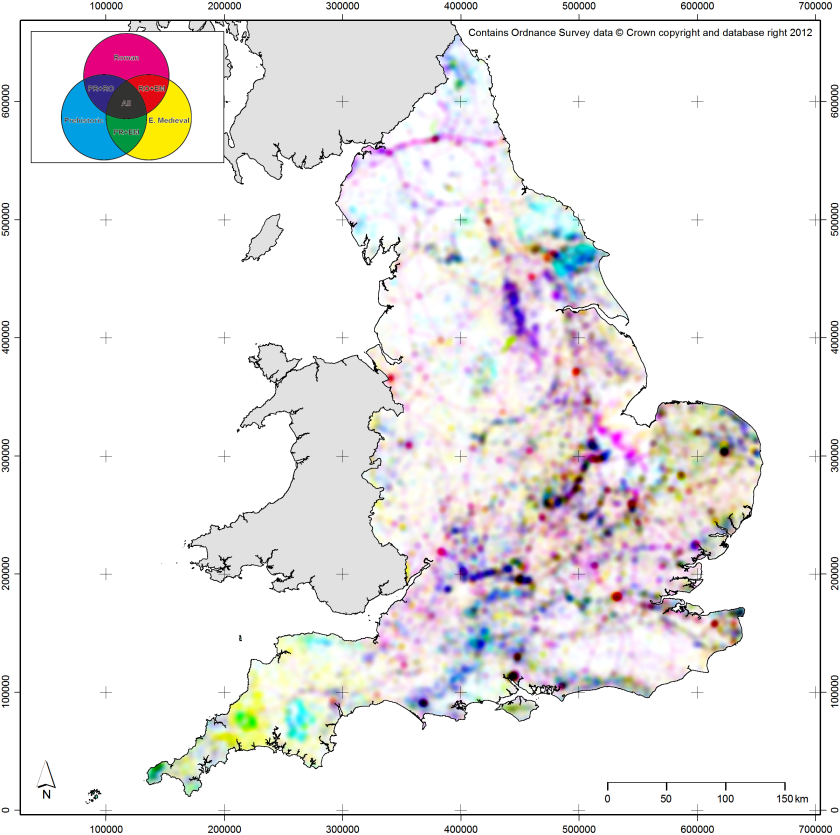
There are various nice patterns in this dataset, including the clear strength of prehistory and the early medieval in the south western peninsula, the intense focus on major river valleys (partly due to the large gravel quarry excavations in those areas), and the appearance of Roman roads highlighted in magenta. The Roman period also looks quite dominant generally, with lots of pinks, blues, and reds visible on the map. There is also a very clear difference in intensity between eastern / southern England and northern / western England.

It is possible to lessen the effects of regional and period based variation, by constructing a series of larger kernel density surfaces and using these to “correct” for regional variation in the period based models. This produces a new model which reflects complexity on a more local scale. Essentially, the first model can be thought of as a model of “globally” scaled (by which I mean the whole of the dataset, not the whole of the planet) complexity and the new model can be thought of as a model of locally scaled complexity:

6 complexity_psychedelia_local

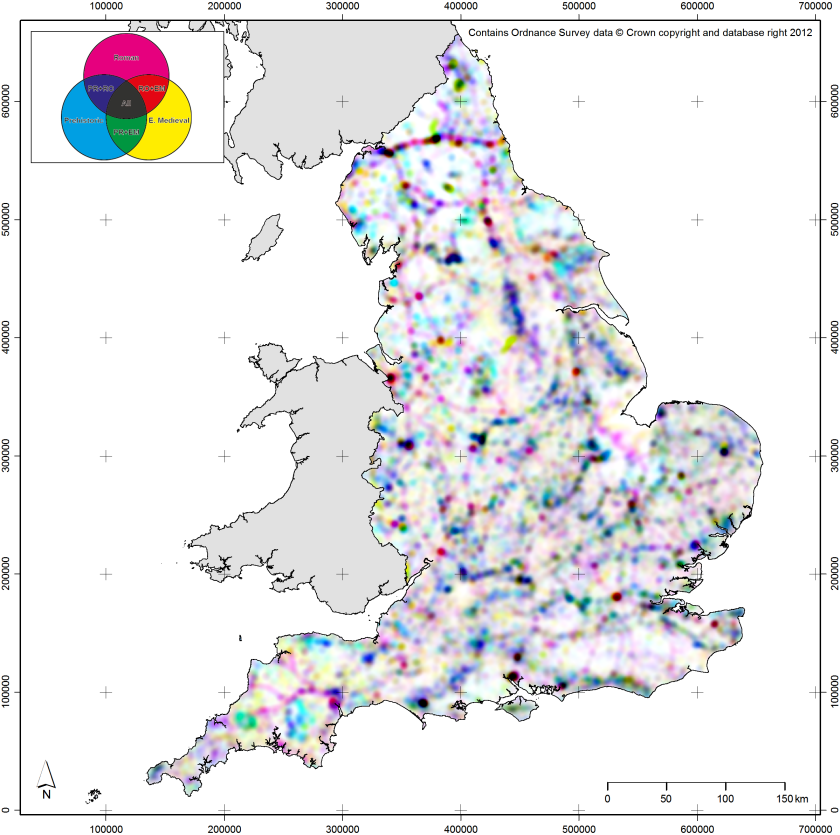
This model also shows some interesting patterns. It is much less dominated by single periods in particular regions, with Roman dominance mostly along the Roman roads and Hadrian’s Wall. There are also some nice dark areas, which show high levels of local complexity across all three time periods. These cluster mostly along rivers again or around the large Roman towns, along with a similar cluster in southern Yorkshire / the north Midlands to that seen in the RRSP data.

As with all models of English archaeology, the images presented here represent a very complex data history, being influenced by both where more (and more visible archaeologically) activity took place in the past and where more modern archaeological activity takes place in the present (largely driven by development). They also, as previously noted, come with considerable caveats in regards to legibility, due to the relatively large minority of people with restricted colour vision (c.8-10% of men, and maybe 1% of women). The technique is also restricted by its inability to map more than three variables, but more than three variables would probably overcomplicate matters even if it were possible. However, I hope that this post gives a sense of the variation and complexity in the English archaeological record, locally, regionally, and nationally.

EngLaId is now winding down, having officially ended at Christmas, so this will probably be the last substantive post on technique or data for a while. We will however announce here when any new publications come out, including our main books.

Chris Green

References:

Allen, M., T. Brindle, A. Smith, J.D. Richards, T. Evans, N. Holbrook, M. Fulford, N. Blick. 2015. The Rural Settlement of Roman Britain: an online resource. York: Archaeology Data Service. https://doi.org/10.5284/1030449

Green, C., C. Gosden, A. Cooper, T. Franconi, L. Ten Harkel, Z. Kamash & A. Lowerre. 2017. Understanding the spatial patterning of English archaeology: modelling mass data from England, 1500 BC to AD 1086. Archaeological Journal 174(1): p.244–280. http://www.tandfonline.com/doi/full/10.1080/00665983.2016.1230436

Smith, A., M. Allen, T. Brindle & M. Fulford. 2016. New Visions of the Countryside of Roman Britain. Volume 1: the Rural Settlement of Britain. Britannia Monograph Series No. 29. London: Society for the Promotion of Roman Studies.

EDIT: Since writing this blog post, Martin Sterry has published a paper on his visualisation techniques, which can be found here: https://doi.org/10.11141/ia.50.15

Pondering regionality

I have recently been pondering the definition of regions, in the sense of carving England (or any country) up into contiguous zones of particular archaeological character. I would suppose that as a method of archaeological enquiry, this probably goes back at least as far as Fox’s division of Britain into “lowland” and “upland” zones along a dividing line running approximately from Dorset to Yorkshire. As a modern practice, I would suggest that recent interest in defining regions probably arises, at least in part, from the influential work of Roberts and Wrathmell (2000).

The reason why I have especially been thinking about this subject of late is due to the way in which two projects contemporary to our own have gone about structuring their reporting of their results. Their final report currently in press (Rippon et al. 2015), the Fields of Britannia (FoB) project divided the country (in this case being England and Wales) up into a series of regions (made up of groups of bio-geographical pays”). Similarly, the Roman Rural Settlement Project (RRSP) has also divided the country up into their own set of regions based upon the archaeological character of the excavated evidence found within each. Both of these projects based their regions around conglomerations of Natural England’s “Natural Areas“.

1 regions
Regions defined by other projects

If we compare these various regions on a map against the “Settlement Provinces” defined by Roberts and Wrathmell (R&W), we can see that there are broad similarities but also substantial local differences between the various regions (and provinces) defined. Herein lies the major problem with projects defining their own regions for analysis and reporting: it makes cross-comparison between different projects’ results difficult. For example, the Chilterns and the Berkshire Downs both fall within the south east regions of R&W and FoB, but within RRSP’s central zone: as such, can their respective “central” zones truly be compared? The simplest solution to this would be defining regions based upon modern political boundaries or, say, 100x100km grid squares. However, such an approach would result in regions that are archaeologically and bio-geographically irrelevant, which is very far from ideal (and so not recommended here!).

More fundamentally perhaps, I am also not convinced that archaeological remains (and thus, by implication, past human culture) truly lacks variety across such continuous areas of space and changes according to such sharp boundaries. I am sure that all of the researchers involved would agree with me on that and there is no doubt that defining regions helps in formulating ideas / arguments and in reporting results. However, I just wonder if there is a better way to structure our space? Some degree of structure is necessary, or all would be chaos and incomprehensible, but could alternative structures be preferrable?

2 HiLo model
Another experimental model (HiLo)

As an experiment, I constructed a regional model for England, but one that did not result in continuous regions, but rather fractured zones spread across the whole country. This model was based upon a mixed classification of elevation and terrain ruggedness and resulted in three new zones: a coastal zone (which largely seems to accord with former wetland areas), a lowland zone, and a highland zone (which seems to capture every important range of hills in England). These zones can exist in pockets within one another: they are not contiguous. Although not (by design at least) archaeologically relevant, these zones certainly have a degree of bio-geographic meaning. Furthermore, they would be reproducible by other scholars, assuming I publicised their construction method. As a Warwickshire man, I am particularly taken with the result that my county almost looks like a “natural” division of the country!

3 regions vs HiLo
Other regions against HiLo

If we compare these three “HiLo” zones (named for Oxford’s infamous Jamaican inn) against the regions of the other projects we can again see some similarities between the borders of my zones and those of the other projects, but again with substantial local differences. Obviously, if we were to use my HiLo regions for reporting on our project, we would just end up compounding the problem of difficulty of comparison, but the experiment remains of interest.

elev_RandW
Elevation: Roberts and Wrathmell
elev_FoB
Elevation: Fields of Britannia
elev_RRSP
Elevation: Roman Rural Settlement Project
elev_HiLo
Elevation: HiLo

I then tested each set of regions against a series of other datasets: elevation, terrain ruggedness, broad soil types, soil wetness, etc. The graphs above show just the elevation results, but the broad conclusions were similar for all comparisons. Essentially, the FoB and RRSP regions look far more distinct than the R&W provinces. This is hardly surprising as they are of smaller spatial extent: the smaller a sample area, the more distinct from the general “population”/pattern a variable ought to tend to be. This is clearly the case here. However, the HiLo model sits somewhere in between. It only has three zones, but they appear far more clearly differentiated than the R&W provinces. As such, we can conclude that they have greater geographic differentiation, due to their non-contiguous nature, despite being of similarly large extent.

8 regions_thes_all
Regions: archaeological variation (area normalised)
9 regions_thes_pc_all
Regions: archaeological variation (percentage)

As a final test, I then compared each set of regions against our archaeological data, using our coarsest level of thesaurus categories. I did this for each broad time period, but the results shown above are for all EngLaID time periods combined (unspecified prehistoric, Bronze Age, Iron Age, Roman, early medieval). The conclusions, interestingly but perhaps not surprisingly, are very similar to those seen when comparing against the “natural” factors described just above. FoB and RRSP regions look fairly distinct, R&W rather homogeneous (albeit with less dense data in the north west), and HiLo regions are more distinct than R&W but less so than the others. Again, the size of regions remains key (due to the MAUP).

Since undertaking these comparative experiments, I have been reading a recent report by Historic England’s Andrew Lowerre (2015). In the second half of the report, Lowerre uses a mixture of environmental variables alongside Roberts and Wrathmell’s data to define regions using automated clustering techniques. The regions that he produced (across a series of different models), much like my HiLo model, are non-contiguous and possess fuzzy borders. As such, to me at least, they seem much more representative of the data than regions defined manually. I wonder if this type of automated region creation is the way forward if we wish to define regions for our analysis and reporting?

Regions are undoubtedly a useful and intuitive way to divide up space that makes analysis and reporting of results within the context of a project relatively simple and straightforward, both in terms of how a team thinks about their data and in terms of how an audience may digest the same. However, the cross-comparison issue is distinctly problematic when one begins to think beyond the bounds of the results of a single project. We could potentially define a set of regions based on the natural environment that all projects should attempt to use, but we as archaeologists often seem to be naturally inclined to always do our own thing, so I am not sure that would be fruitful. Plus the set of regions defined might not be relevant across multiple time periods.

As such, I do wonder if we ought to avoid the idea of archaeological character regions altogether and just talk about variation in data across space. So long as that data is quantifiable and mappable as continuous fields, then cross-comparison becomes simple: map overlay is after all the most obvious application and strength of GIS, with whole suites of tools and methods dedicated to it.

This post is not intended as a criticism of the methods of other projects, which have undoubtedly proved fruitful and interesting in each case. I just wanted to express why I feel we (as EngLaID) ought to avoid regions in our reporting, especially as a project looking across traditional period boundaries. Others might disagree, but I do feel the cross-comparison issue of bespoke regions is a thorny problem, particularly for those interested in broad syntheses across time and space.

Chris Green

References

Lowerre, A. 2015. Rural Settlement in England: Analysing Environmental Factors and Regional Variation in Historic Rural Settlement Organisation Using Regression and Clustering Technique. Portsmouth: English Heritage. http://research.historicengland.org.uk/redirect.aspx?id=6288

Rippon, S., C. Smart and B. Pears. 2015 (in press). The Fields of Britannia: Continuity and Change in the Late Roman and Early Medieval Landscape. Oxford: Oxford University Press.

Roberts, B. and S. Wrathmell. 2000. An Atlas of Rural Settlement in England. London: English Heritage.

More on mapping pottery

Further to my previous post on mapping broad-brush pottery distributions, I was reasonably content with the maps for prehistory and the Roman period (albeit that they had significant shortcomings in terms of temporal currency), but I was not really satisfied with the amount of data I could find for the early medieval period. One particular shortcoming was the lack of data for the earlier half of the period, for which I had been able to discover very little.

After my blogpost, Helena Hamerow found a map in a publication by Catherine Hills which included a map of earlier Anglo-Saxon pottery. A little bit more investigation showed that this was adapted from Myres 1969 (Map 1). As such, it is clearly a very old source, with no evidence included from the massive post-1990 explosion in developer-funded archaeology, but it seems to remain the most complete national map for the period. I therefore digitised the dots in this map and the Blinkhorn (2012) map referenced previously and turned them into density surfaces. With this simple task complete, it felt like my picture was becoming more useful:

em_pot_v2
Blinkhorn, Myres (labelled Hills) and Vince overlaid.

However, the fact that the Myres data is quite so out-of-date suggested we ought to find some more modern proxy for the ceramic evidence. Letty suggested we ask Toby Martin, a British Academy postdoc here at the Institute, if we could use his corpus (2011) of Anglo-Saxon furnished graves (C5th to C6th) as just such a proxy, insofar as she felt that the people buried in such a fashion should also be people who use pottery. Toby was happy to oblige and so I created a model using a density plot of his data in addition to the previously mentioned three sources. Because Toby’s material is not actually ceramics but just being used as a proxy, I gave his data a lower weighting in the model. I did the same for Vince (1993) as his zones are rather too vague in extent for my purposes here. So, essentially, all of the four sources were normalised by their maximum value (so that they varied between 0 and 1), and then combined as follows (in two steps, so I could separate out earlier and later):

(Myres + 0.5 Martin) + (Blinkhorn + 0.5 Vince)

em_pot_v3_all
Combined model inc. Martin in addition.

However, there is one very clear problem with this model and that is that all of the sources used are explicitly “Anglo-Saxon”. In other words, where are the “Britons”? Toby and I did a bit of investigating and found a very interesting PhD thesis by Imogen Wood (2011) which included three maps of Cornish pottery of the early medieval period. This was exactly what I needed to help colour at least one of the none “Anglo-Saxon” parts of the map. Rather nicely, Wood’s first map was largely temporally coincident with Myres and Martin and her second map largely temporally coincident with Blinkhorn and Vince. So, I simply expanded the model as follows (again split into two stages):

(Myres + 0.5 Martin + Wood_early) + (Blinkhorn + 0.5 Vince + Wood_late)

em_pot_v4_all
Final model also including Wood.

The final model is shown above. I also have a couple of maps which split this out into the earlier (C5th-6/7th) and later (C7/8th-9th) parts of the early medieval period, but I feel that the combined model is probably the most robust. Although some of the input data is not perfect due to its age (Myres) or its spatial vagueness (Vince), I feel that is probably the best model we can currently construct for broad brush early medieval pottery presence / absence, at least without putting in substantially more work.

Any thoughts or disagreements are more than welcome, however!

Chris Green

References

Blinkhorn, P. 2012. The Ipswich Ware Project: Ceramics, Trade and Society in Middle Saxon England. Medieval Pottery Research Group Occasional papers.

Martin, Toby F. 2011. Identity and the cruciform brooch in early Anglo-Saxon England: an investigation of style, mortuary context, and use. Unpublished PhD thesis, University of Sheffield.

Myres, J.N.L. 1969. Anglo-Saxon pottery and the settlement of England. Oxford: Clarendon Press.

Vince, A. 1993. “Forms, Functions and Manufacturing Techniques of Late Ninth- and Tenth- Century Wheelthrown Pottery in England and their Origins.” In D. Piton (ed.), Travaux du Groupe de Recherches et D’Etudes sur la Céramique dans le Nord – Pas-de-Calais; Actes du Collque D’Outreau (10 -12 Avril 1992). Numéro hors-série de Nord-Ouest Archéologie, pp.151-64.

Wood, Imogen. 2011. Changing the fabric of life in post-Roman and early medieval Cornwall: an investigation into social change through petrographic analysis. Unpublished PhD thesis: University of Exeter.

Mapping pottery

Following on from suggestions (primarily by Prof. Barry Cunliffe) at our Academic Advisory Board meeting last year, we started thinking about how we might map aceramic (or minimally ceramic-using) zones through our time period. Due their general commonness and generally diagnostic nature, ceramic finds are probably the most commonly used method for dating archaeological contexts and, thus, by extension sites as a whole. As such, in areas where ceramic objects were little used, it becomes more difficult (and probably more expensive) to date sites. This, in turn, is likely to result in sites in aceramic areas being less precisely dated. This could, therefore, bias the distribution of sites of a particular period in the archaeological record, as sites in aceramic zones within a particular period are less likely to be securely dated to that period.

However, actually mapping aceramic zones is not especially easy. To do so, one must first map areas where ceramics are used, and collating data on that scale for 2,500 years of human history would almost certainly be a research project in itself on a similar scale to EngLaID as a whole. Therefore, we had to try and obtain the results of previous attempts at pottery synthesis.

We began with prehistory. The only existing national database which we could find of later prehistoric (Later Bronze Age to the Roman conquest) pottery was that created by Earl et al. (2007), archived at the ADS. The data collection for that project took place in 1995-6, so it is almost twenty years out of date, but it was the only reasonably comprehensive data source available to us. We hope that the broad brush picture will have not changed substantially in the past twenty years (albeit see below for the early medieval period), but until another such project is undertaken it is impossible to be certain.

1 earl_pot_density_ALL
Density of later prehistoric pottery records

Simply plotting the density of records in this database shows a distinct bias in the distribution of later prehistoric pottery towards the southern and eastern half of England (essentially, Cyril Fox’s “lowland” zone of Britain), with the exception of a notable lack of pottery in the Weald and on the South Downs, and small peaks of pottery in western Cornwall, East Yorkshire, and County Durham. North Devon and large swathes of the West Midlands and the north west show a distinct lack of ceramic usage (or at least recovery by archaeologists).

2 earl_pot_density_phased
Density of LBA to EIA vs MIA to Conquest period pottery records

We can nuance this picture slightly by looking at change over time.  Following discussion with the prehistoric experts on the team, I split the data temporally into two broad time periods: Late Bronze Age to Early Iron Age, and Middle Iron Age to the conquest. The pattern that results seems to show a movement (of the peak in density) away from Wessex and northwards into the East Midlands, which could be the result of any number of factors (population growth, environmental change, etc.).

3 earl_pot_density_UnspecPrehist
Density of unspecified prehistoric pottery records

However, there are also large numbers of unspecified later prehistoric records in the database (especially in East Anglia), so temporal patterns should not be too heavily emphasised.

4 earl_pot_sherdcount_ALL_overEI
Sherdcounts of prehistoric pottery over density of prehistoric records in EH’s Excavation Index

Many of the records in the database also record sherd counts of the assemblages recorded, which helps to nuance the picture further. In an attempt to see if the patterns produced when mapping the database records simply stemmed from where archaeological work takes place (which inevitably they must to some extent), I mapped the records against the density of later prehistoric events recorded in English Heritage’s Excavation Index. As the map above shows, there does appear to be a fairly strong correlation. However, there are low peaks in the density of events in the north west which are not represented in the pottery database, so the pattern is not entirely determined by modern archaeological practice.

5 earl_pot_sherdcount_ALL_over14Cprob
Sherdcounts of prehistoric pottery over modeled radiocarbon probability for same period

To take this further, I also mapped the sherd counts against a modeled surface of radiocarbon probabilities for the same period (see previous post). This seems to show that there are areas of relatively high radiocarbon probability in apparently aceramic zones, suggesting that activity was taking place in those areas at that time. This helps to suggest that our aceramic zones, although partially biased by patterns of modern archaeological practice, are reasonably likely to be real. For later prehistory, then, it does appear that there was less use of pottery in the north west, the West Midlands, and in north Devon.

Moving on to the Roman period, the best source of national level data which we could find is Paul Tyers’ excellent Potsherd website. Naturally, collating sherd count level data for the Roman period would be an immense task (due to the incredible amount of ceramics deposited on Roman sites): as such, Tyers maps pottery by ware type on a presence / absence basis (by 10x10km square). His maps are all dated 2004, so we assume that the data mapped is around ten years out of date. Again, it is assumed that broad brush patterns will not have changed immensely, although proving that would be difficult.

Tyers provides encyclopaedic detail on his website, but does not offer direct downloads of his data. Fortunately, his maps are all relatively high resolution and all constructed in the same way, so it is possible to perform various trickery on them in order to study them further in GIS. It then becomes feasible to sum Tyers’ maps together and produce a map of variability in pottery wares across Romano-British England. As such, this is not directly comparable with the later prehistoric maps discussed above, as we are mapping the number of different ceramic wares deposited across England for the Roman period, rather than the density of records (i.e. site assemblages) for prehistory.

6 tyers_ware_density
Roman pottery variability

The map above shows the overall variability in Roman pottery across England, based on Tyers’ data. Dark blue areas have no pottery (the aceramic zones we sought) and red areas have many different types of pottery. The results are quite interesting: the greatest variability in pottery wares is in a similar region to the greatest density of later prehistoric pottery records, i.e. in the south and east of England. However, the zone covered is significantly larger and there are also further significant peaks in otherwise “quiet” areas, particularly around the Roman cities and military sites.

7 tyers_ware_density_domestic_imported
Roman pottery variability: domestic vs imported

We can, however, take this further. Comparing variability in domestic and imported wares, we can see that the areas with greatest variety in imports were around the major settlements and, in particular, around the Thames estuary. By contrast, the greatest variability in domestic wares was more widespread.

8 tyers_ware_density_coarseware
Roman pottery variability: coarsewares
9 tyers_ware_density_fineware
Roman pottery variability: finewares
10 tyers_ware_density_terrasigilata
Roman pottery variability: terra sigilata / Samian ware
11 tyers_ware_density_mortaria
Roman pottery variability: mortaria
12 tyers_ware_density_amphorae
Roman pottery variability: amphorae

Further patterns emerge when looking at more specific groups of wares. Coarsewares are quite well spread; finewares largely restricted to the south; terra sigilata is very clustered; mortaria are well spread and possibly rural in character; amphorae are very tightly clustered into small areas.

13 tyers_ware_density_overtime
Roman pottery variability: over time (smaller version here for tablets etc.)

We can also look at change over time, which also shows some interesting patterns, with the peak of variability being most widespread (albeit largely southern) in the 3rd and 4th centuries. The strong 5th century peak in Cornwall is caused by imported wares from the eastern Mediterranean.

Overall, the patterns produced by mapping Tyers’ data in this way can potentially tell us interesting things about pottery supply in the Romano-British period, in particular in regard to economic factors (as availability of different ceramic wares must be linked to economic conditions / opportunity to some extent). Also, although we have mapped somewhat different things, certain comparisons can be made with the later prehistoric data: areas with less ceramics in the Romano-British period were less widespread than in later prehistory, but in generally the same places, especially if you mentally factor out the influence of military garrisons.

14 Vince_Blinkhorn_C9_pot
9th century AD pottery industries (after Vince 1993; Blinkhorn and Dudd 2012)

Moving finally to the early medieval period, we struggled to find any datasets of anything like the degree of comprehensiveness of either the Earl et al. or Tyers data. The best source discovered was a fairly old article by Alan Vince (1993), which mapped the major pottery industries of the 9th century AD. However, it does appear that this map was now quite out of date, as his zone of Ipswich Ware (highlighted in red above) was much more restricted than the areas recorded recently by Blinkhorn (2012) (black dots and shaded in grey: it is assumed that the grey shading is record density by modern administrative region, but the map had no legend). This also only really covers the very end of our period, when wheel thrown pottery came back into production in England: we have no data for the mid-5th to 8th centuries. As such, it is hard to draw any conclusions at all about the early medieval picture.

In conclusion, largely aceramic zones probably existed in later prehistory in the north west, the West Midlands and the south west. These largely persisted into the Roman period, albeit with ceramic using areas around the military installations and larger settlements. In the early medieval period, we do not have enough data to reach even tentative conclusions, but we might assume that the same areas continued to use less pottery than in the south and east? Or that might be plain conjecture.

Chris Green

References:

Blinkhorn, P. 2012. The Ipswich Ware Project: Ceramics, Trade and Society in Middle Saxon England. Medieval Pottery Research Group Occasional papers.

Earl, G., E. Morris, S. Poppy, K. Westcott, T.C. Champion. 2007. Later Prehistoric Pottery Gazetteer. http://dx.doi.org/10.5284/1000013

Tyers, P.A. 2014. Potsherd. http://potsherd.net/atlas/potsherd

Vince, A. 1993. “Forms, Functions and Manufacturing Techniques of Late Ninth- and Tenth- Century Wheelthrown Pottery in England and their Origins.” In D. Piton (ed.), Travaux du Groupe de Recherches et D’Etudes sur la Céramique dans le Nord – Pas-de-Calais; Actes du Collque D’Outreau (10 -12 Avril 1992). Numéro hors-série de Nord-Ouest Archéologie, pp.151-64.

Addendum – 12/01/2015:

In an attempt to see if the aceramic zone in the north of England in later prehistory was genuine or an artefact of modern archaeological practice, we mapped hillfort excavations prior to 1997 recorded in English Heritage’s Excavation Index (mapped as green diamonds) against hillfort ceramic assemblages recorded by Earl et al. (up to 1996). The results do appear to show that, on the whole, hillfort excavations do produce pottery in the southern half of England, but largely do not in the northern half, with the notable exception of northern Northumberland. This suggests that this is likely to be a genuine aceramic zone:

15 earl_pot_sherdcount_Hillforts_overEI
Hillfort excavations recorded in EH’s Excavation Index (pre-1997) against hillfort ceramic assemblages


Medieval Master Chef in Istanbul (Dan Stansbie)

I’ve recently been lucky enough to have enjoyed a trip to Istanbul, along with colleagues from the EngLaId project (https://englaid.wordpress.com) to present a paper at a session comparing eastern cuisine and western food customs (http://www.pomedor.mom.fr/meetings/content/80) in the middle ages at the annual European Association of Archaeologists conference (http://www.eaa2014istanbul.org/site), courtesy of the Meyerstein Fund at the University of Oxford.

The conference itself was an enormous event attracting approximately 3000 archaeologists from all over the world and taking over the buildings of Istanbul Technical University almost entirely. Sessions ranged over every archaeological topic imaginable from the Paleolithic to Heritage Management, and outside of the main business of the conference delegates were treated to a reception in the Istanbul Archaeological Museum and the gardens of Topkapi Palace and a party on a platform at Sirkeci train station.

The session at which I spoke was brilliantly organised by Joanita Vroom, Roos van Oosten (both of Leiden University) and Yona Waksman (of Laboratoire Archéomérie at Archéologie at the University of Lyon). The scope of the session was eating habits and food practices in medieval Europe using different approaches, with a particular focus on linking “cooking revolutions” to changing pottery shapes, food customs, dietary practices and house transformations. The session organisers were very reassuring to the relatively inexperienced PhD students like me, and a succession of useful papers discussing evidence for eating and drinking from a variety of medieval contexts including Islamic Iberia and post-reformation nunneries in Modena ensued. A particular highlight of the session for me was Roos van Oosten’s paper on the relationship of the shape of medieval pots from the Low Countries to other aspects of contemporary material culture, such as types of fuel used and the placement of hearths within buildings.

My own paper was essentially a version of research which I’ve previously blogged about for Food For Thought under ‘”Big Data” and Food in Roman Britain” and so I won’t go into it in detail here; except to say that I focused on changes in eating and drinking from late Roman to early medieval England in order to make the research relevant to the themes of the session. I also used my paper to showcase a new case study using the site of Yarnton in the Upper Thames Valley. In this case study my argument is that changes in domestic architecture at Yarnton from the late Roman to middle Saxon period may be linked to changes in food; specifically that the adoption of halls in the middle Saxon period may reflect a shift to more communally oriented forms of ceramic and therefore more communal eating habits.

Outside of the conference much fun was had by the EngLaId team. We got to know the streets of Istanbul, looked after a cat named Morris, consumed the local street food, including the tremendous fish sandwiches from the boats at Eminonu pier, met up with old friends and attempted (unsuccessfully) to track down the elusive Dr Joy (of Cambridge University) through the bars and back street kebab houses around Taksim Square.

Members of the EngLaId team exploring the Theodosian walls

IMG_7326

MSRG Winter Seminar, 3 December 2011

On 3 December, the English Landscape and Identities project presented a poster at the 2011 Winter Seminar of the Medieval Settlement Research Group, held at Newcastle University. The seminar was entitled ‘Heartland to Frontier: The Tees-Forth Region in the Middle Ages’, incorporating a number of papers that presented new evidence from excavated settlements and finds in this north-eastern region. As two of the case studies that the EngLaId project will carry out are also situated in this general area, it was extremely useful to attend the Winter Seminar. The project poster was well received and generated some useful comments from MSRG members.

The MSRG Winter Seminar was coupled with the MSRG AGM, during which one of the EngLaId project members, Letty ten Harkel, was elected as committee member for the MSRG, laying the basis for continuing contact and co-operation between the English Landscape and Identities project and the MSRG which, we hope, will be mutually beneficial.