Field system orientation

Firstly, EngLaID is now on Twitter!  Our handle is @englaid_oxford if you want to follow us.

Now onto business.  I’ve been recently starting to think about how we might analyse field systems of our period in GIS, initially in order to test if patterns seen by previous research projects look true and then to try extending methodologies developed to fresh areas.  In order to undertake this, I am using NMP data, as that is the best source we have for widespread transcriptions of field system layouts.

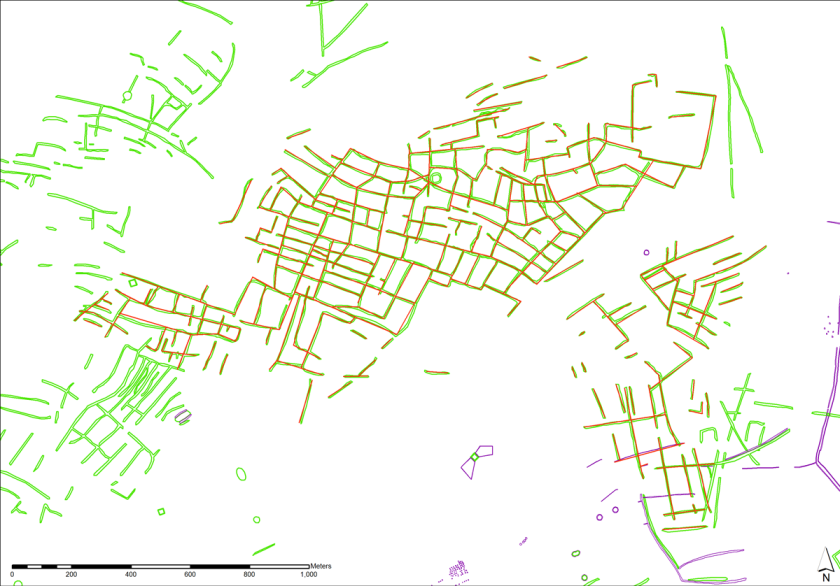
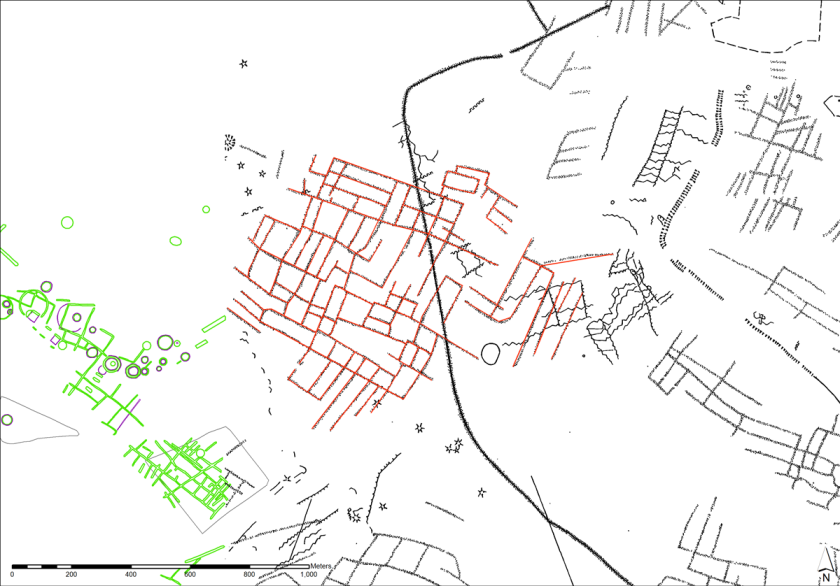
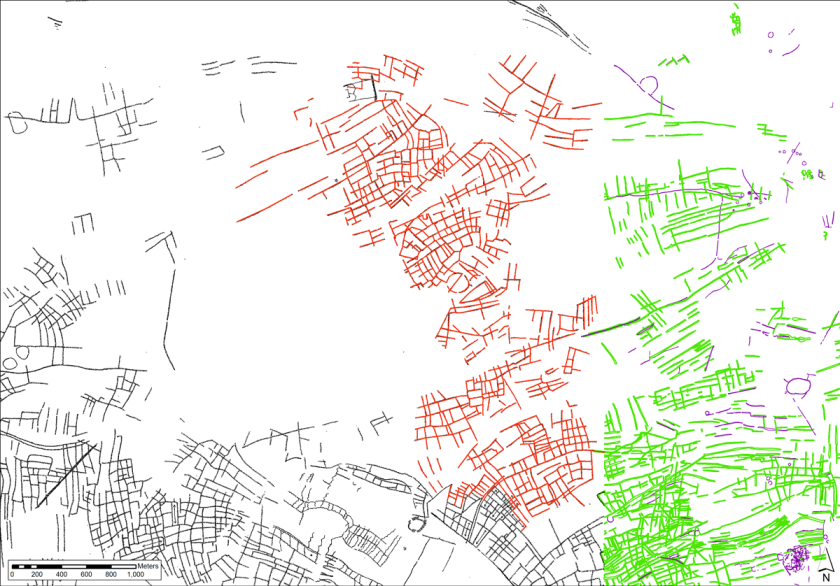
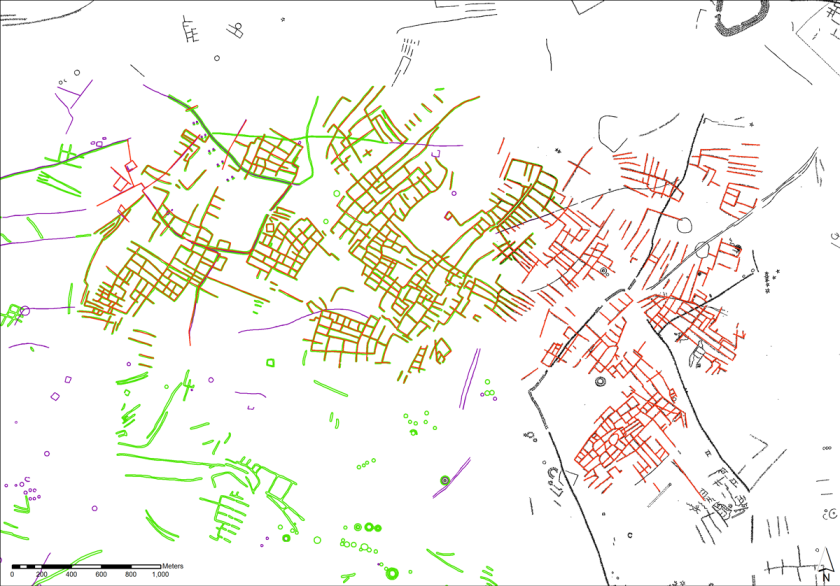
We decided to start with the Salisbury Plain Training Area (SPTA) as that was the subject of an excellent and very detailed study by a team at English Heritage (and RCHME?) (McOmish et al. 2002).  In six specific areas, they discovered areas of co-axial field system aligned (in five of the six cases) in an approximately SW – NE direction (the exception, Maddington, was aligned on 62˚ east of north) (McOmish et al. 2002: Fig 3.4; 54).

In order to test these conclusions and, if validated, to see if I could come up with a methodology for analysing further field systems outside of the SPTA, I redrew these six areas of field system in ArcMap and then calculated the length and bearing (from 0˚ to 180˚ as there is no direction of travel implied) of each section of line.  Using a mixture of Python and R, I then produced a series of radial graphs, showing the density of line bearing / length for each field system against the supposed dominant axis.

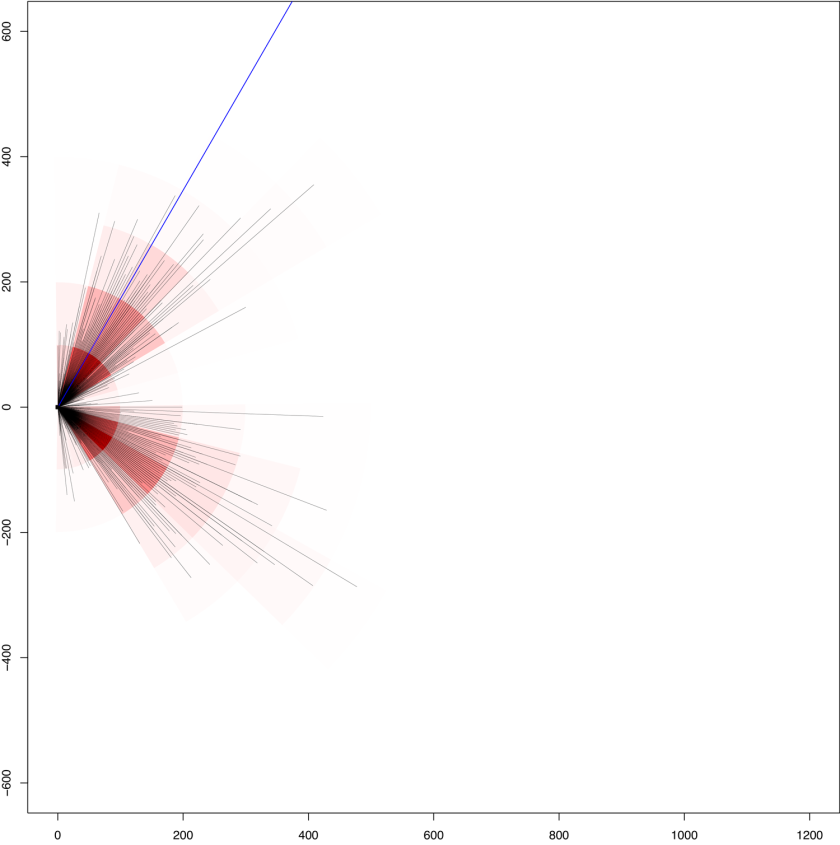
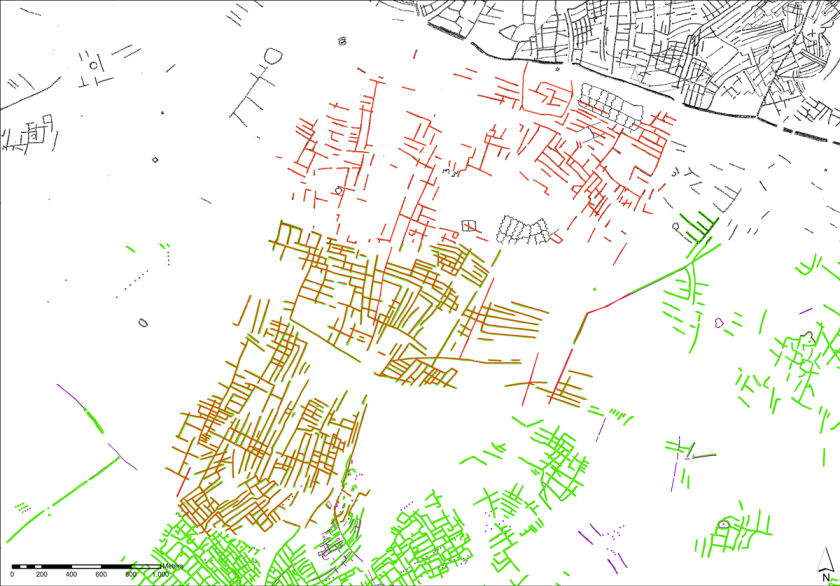
Below, you will see a plan of each field system with the redrawn features in red (green / purple / black features are the original NMP layers, apologies to the colour blind!).  Then each will be followed by a radial graph of the line lengths / bearings.  Each black line is a single section of field boundary.  The blue line shows the apparent orientation defined by McOmish et al.  Then the red shading shows the density of of the black lines in a series of 15˚ / 100 metre bands: the more saturated the red, the more lines present.  If the orientations previously defined were correct, then we would expect to see the red sections of the graph clustering around the blue line and at 90˚ perpendicular to the blue line.
Orcheston_layout
Layout of field system at Orcheston.
Orcheston_graph
Radial graph for Orcheston.
Netheravon_layout
Layout of field system at Netheravon.
Netheravon_graph
Radial graph for Netheravon.
MilstonDown_layout
Layout of field system at Milston Down.
MilstonDown_graph
Radial graph for Milston Down.
Maddington_layout
Layout of field system at Maddington.
Maddington_graph
Radial graph for Maddington.
Longstreet_layout
Layout of field system at Longstreet.
Longstreet_graph
Radial graph for Longstreet.
Figheldean_layout
Layout of field system at Figheldean.
Figheldean_graph
Radial graph for Figheldean.

So, does this tell us anything?  I feel that there is strong support for the previously identified alignment at Orcheston, Milston Down and Figheldean and reasonable support at all of the other three in addition.  Netheravon has a weaker appearance, but this is not surprising due to the section in the south east of the area that does appear to be on a different alignment.  Interestingly, Maddington shows some bias towards its previously defined alignment, but less bias towards the 90˚ perpendicular alignment.

After histogramming the Riley’s Terrain Ruggedness Index for these areas, I could see that all of them are relatively flat, so it would have been easier for people in the past to ignore local topography when laying out their fields.  I now want to apply this methodology to other areas (as I think it works!) and see if any different results come out, especially in areas with more rugged topography.  I will do this in the New Year.

Happy Xmas everyone!

Chris Green

References:

McOmish, D.; Field, D.; Brown, G.  2002.  The field archaeology of the Salisbury Plain Training Area.  Swindon: English Heritage.

Excavation Index over time

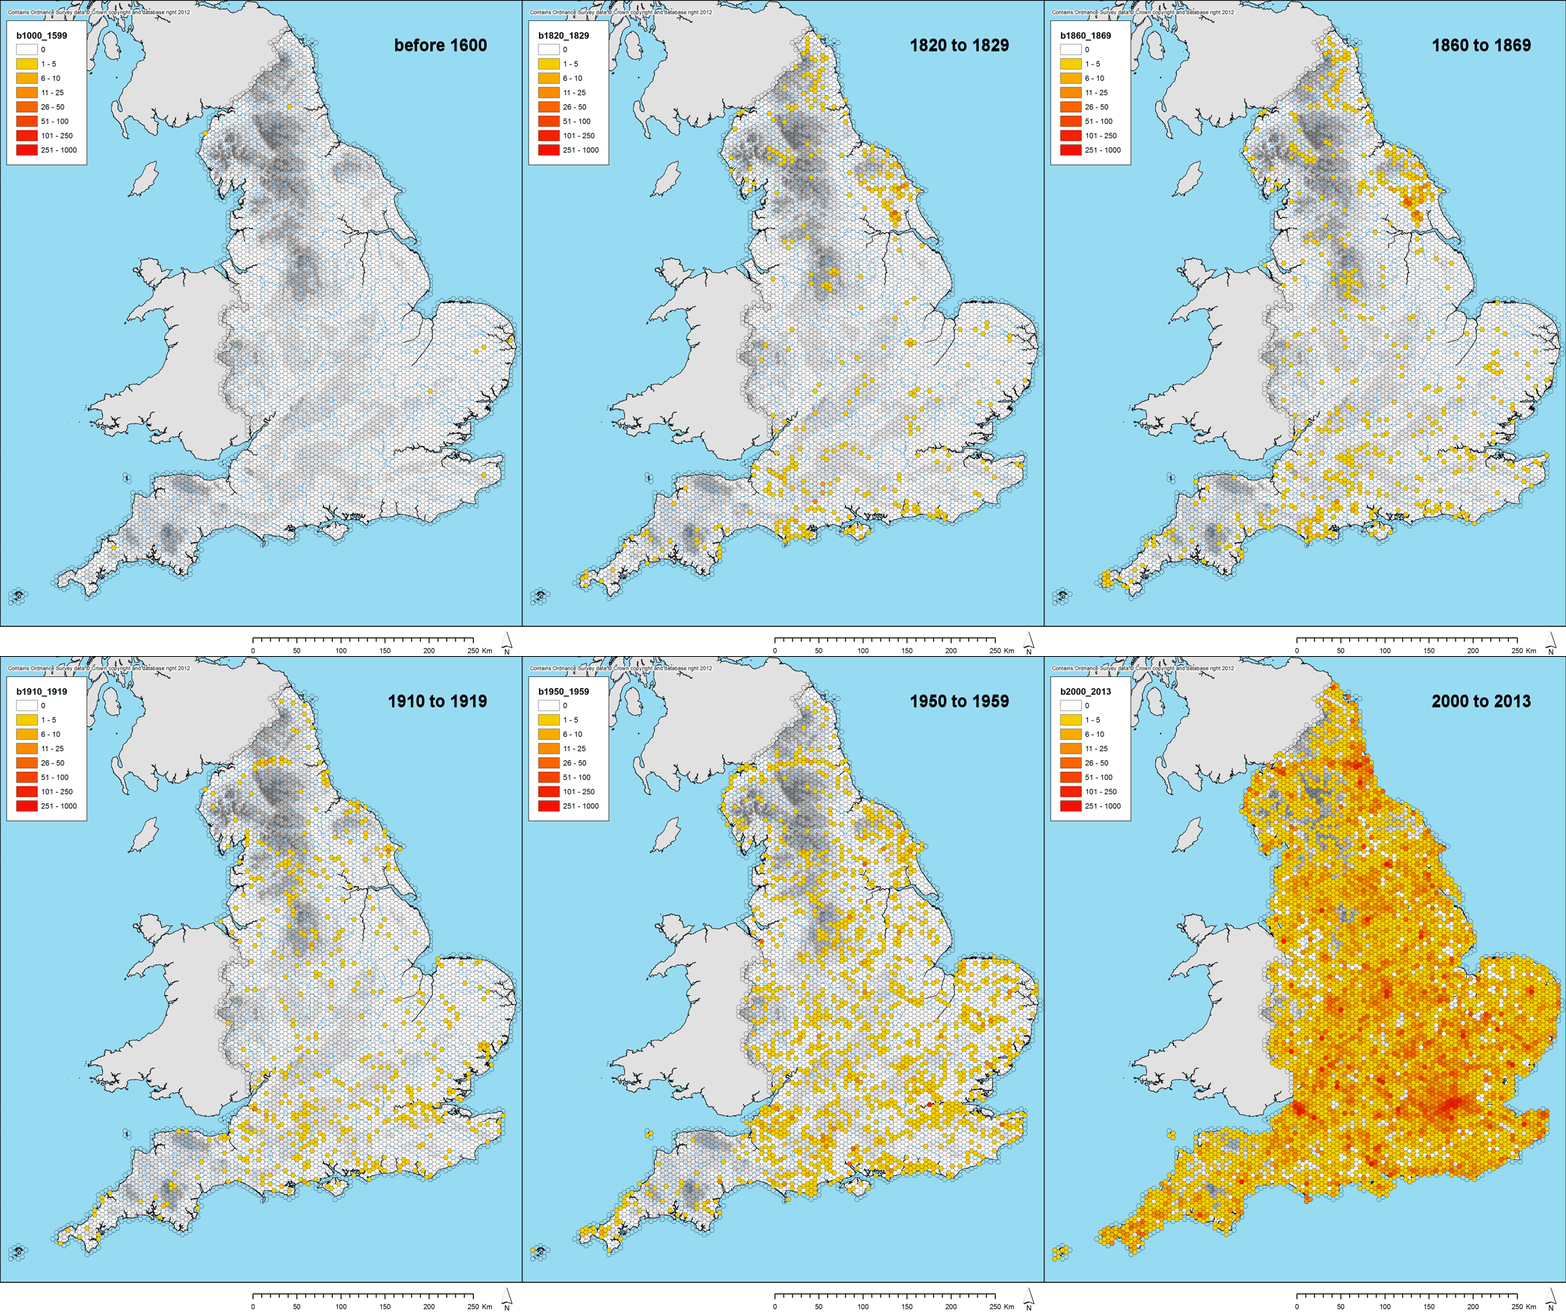
I’ve been playing around a bit more with the English Heritage Excavation Index (see previous).  The majority of the records in the Index have been given a start and an end date for the investigation undertaken, with the first one happening in the 13th century!  We can take these start / end dates and divide by time slices and then collate by hexagonal bin to create an animation of archaeological investigation in England over the last few hundred years (you may need to click on the image to see the animation):

EH_excind_overtime
Animation of EH Excavation Index over time.

Although this is unlikely to be a perfectly complete picture, it is quite an interesting one, I think.  Some of the persistent areas of investigation in the 19th century are likely to be due to uncertainly recorded start / end dates rather than work that lasted for decades, but this factor should be minimal from 1900 onwards.

Chris Green

Extracting trends (VIII)

This is yet another short post about trend surfaces, following on from previous (I)(II)(III)(IV)(V)(VI)(VII), but with a new dataset.  After this, I think I have probably exhausted the possibilities for getting information out of our data using trend surface modelling, which is best thought of as an initial exploratory technique in any event.

This time, I have been looking at spatial trends present in English Heritage’s Excavation Index, which has been kindly supplied to us by Tim Evans at the ADS, who recently wrote an excellent journal article on the potential of the Index as a research tool.  This is a record of excavations and investigations that have taken place in England since around the mid nineteenth century.  I do not think that it pretends in any way to be comprehensive, but it is another way of filling in gaps in our data, especially for archaeological work that took place before 1990.

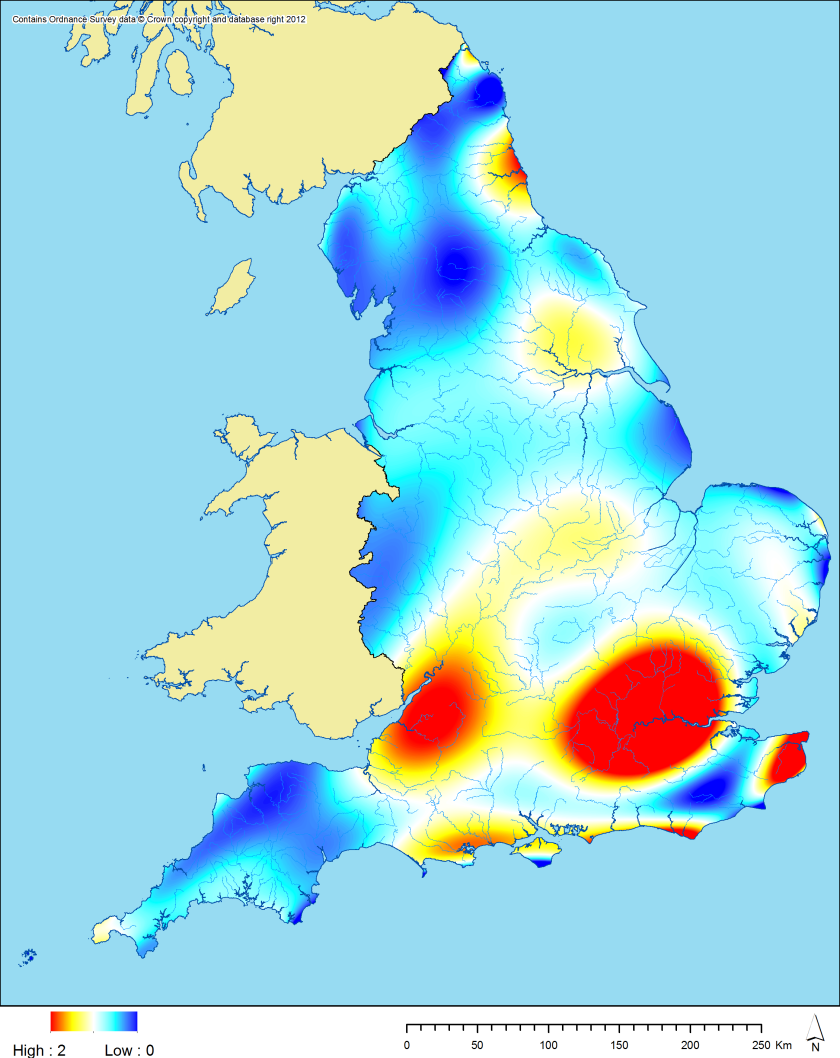
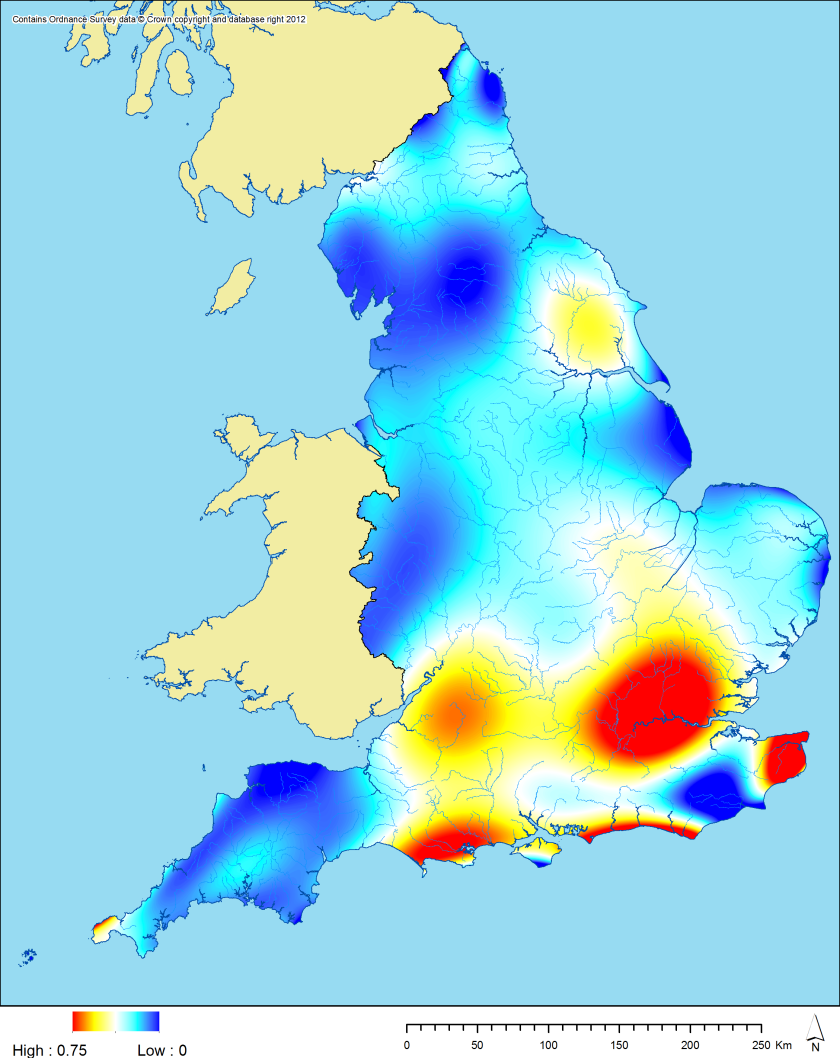
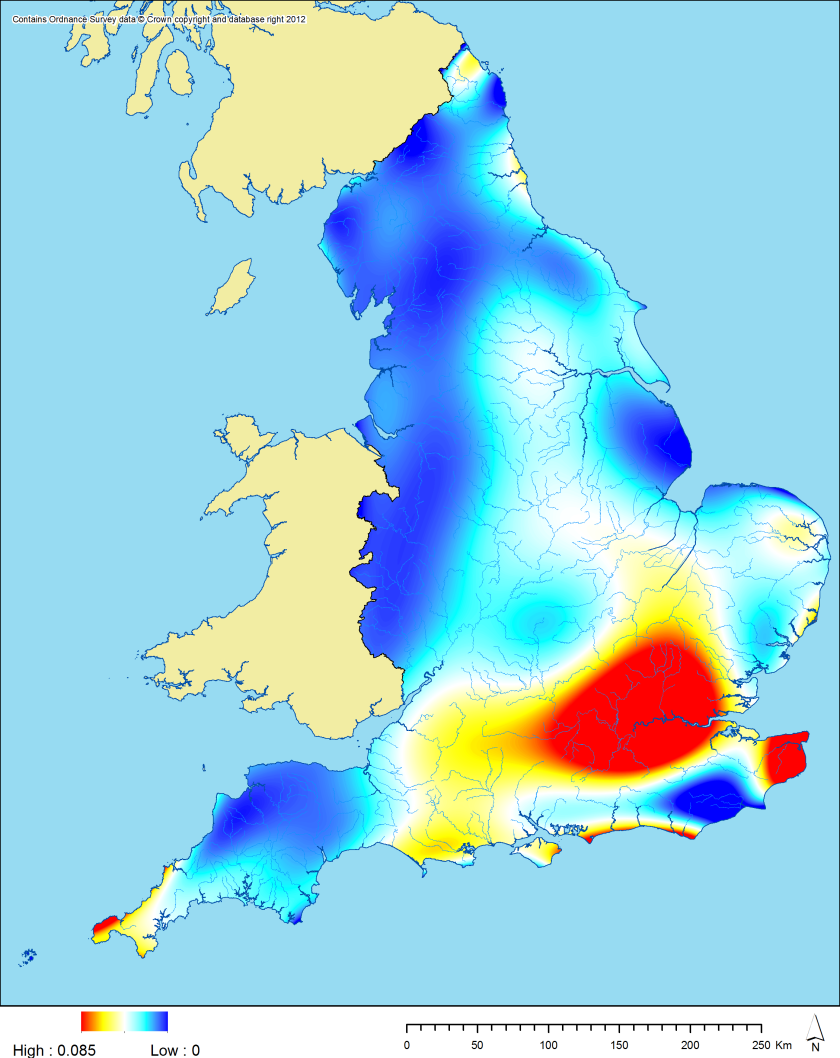
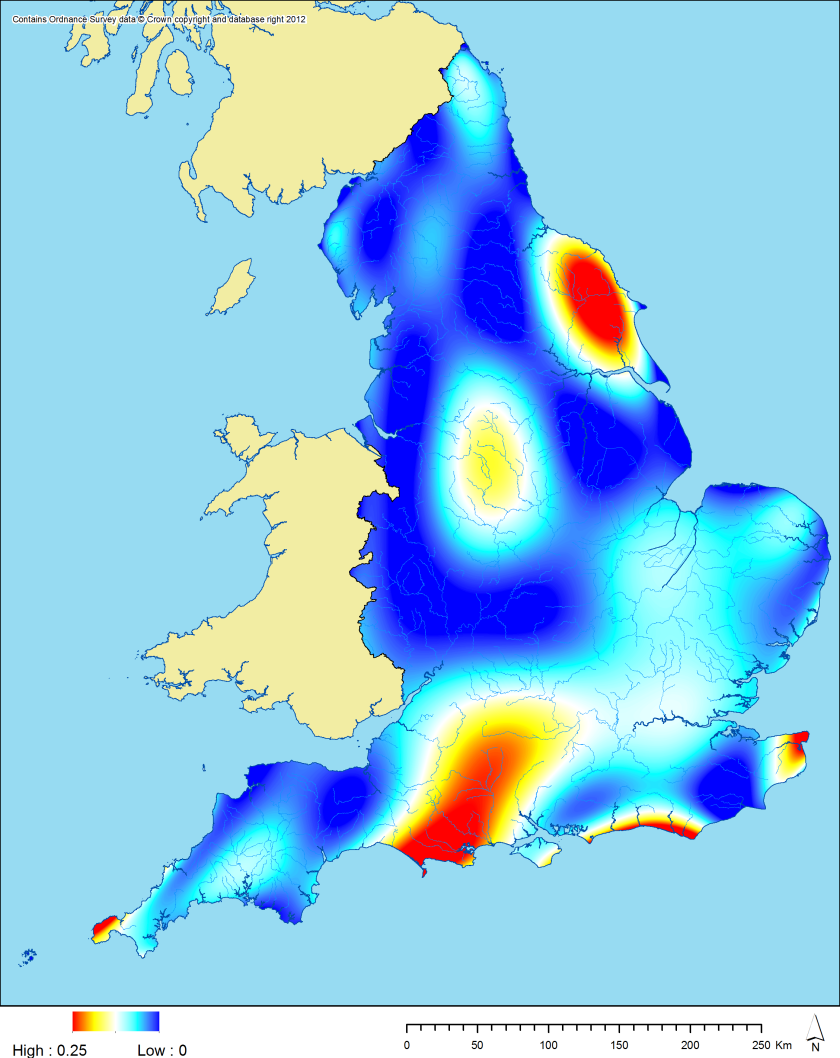
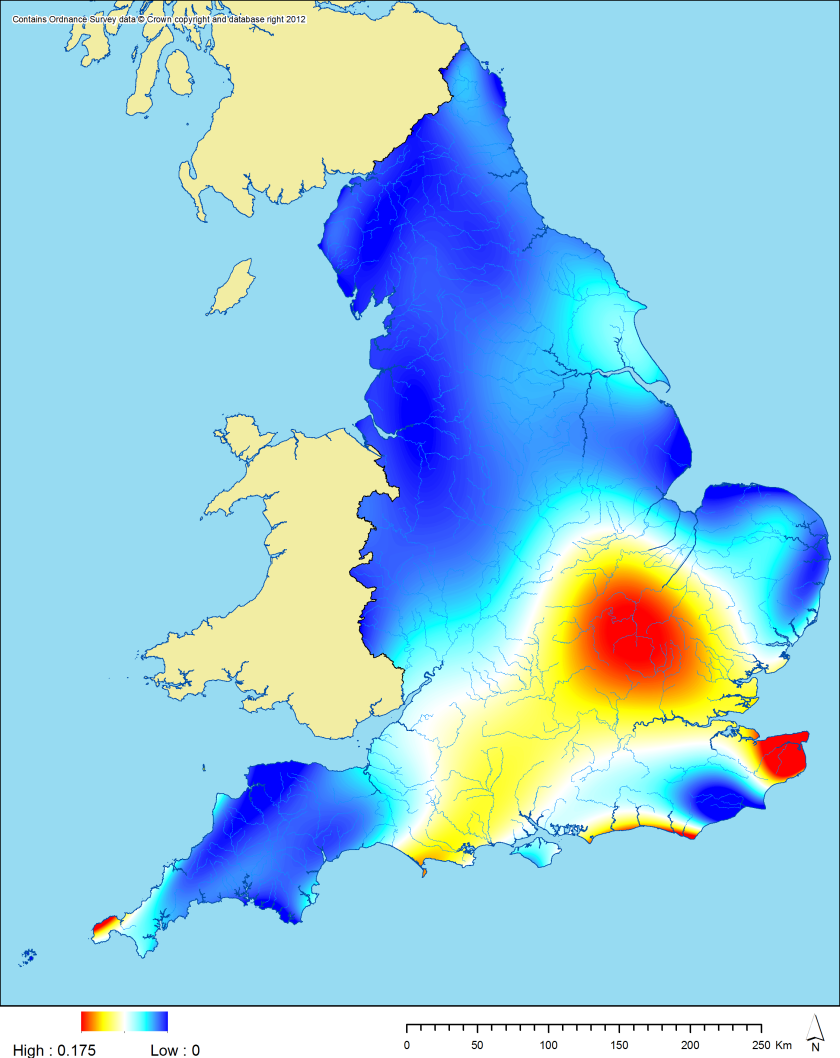
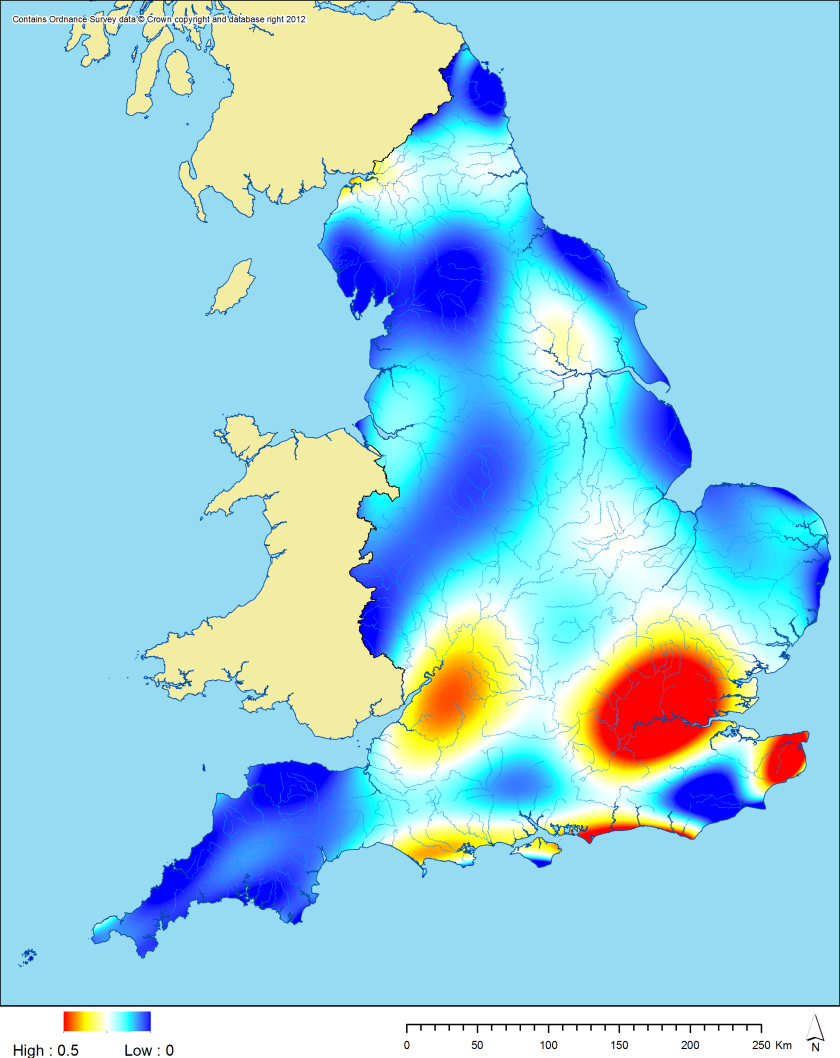
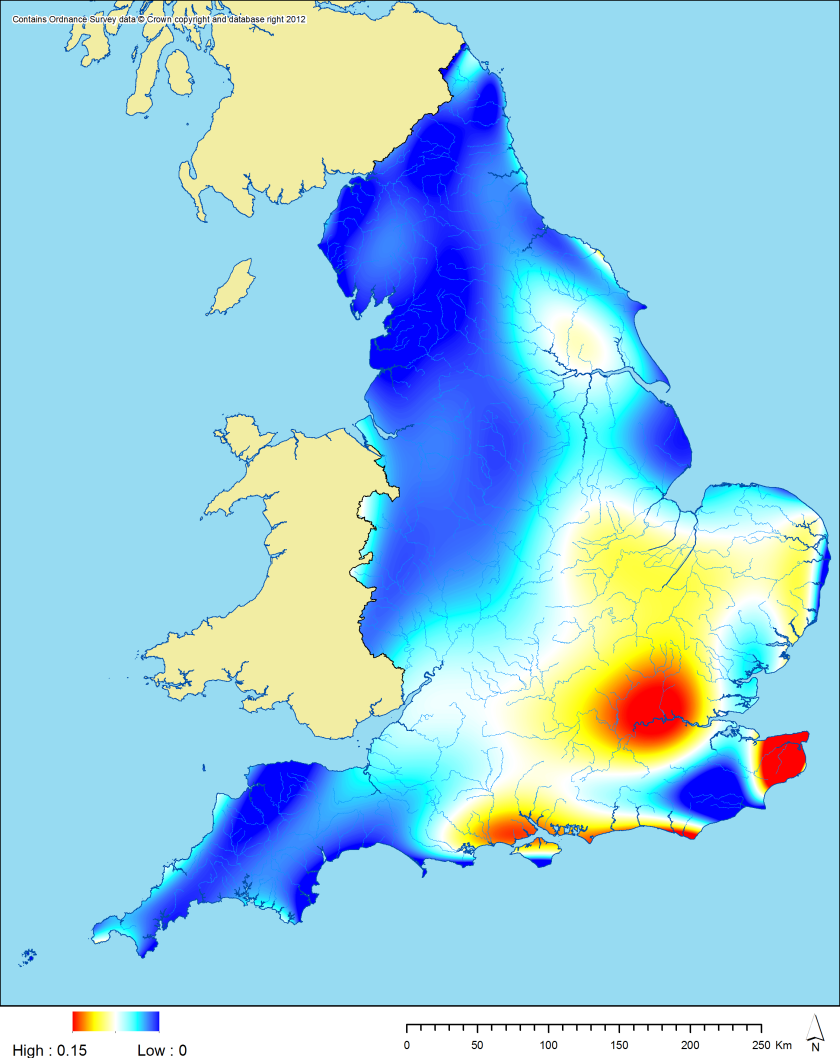
In any event, here are the trend surfaces that I have created based upon the Excavation Index (to different scales [the values being records per sq.km], but the broad picture is the important thing):

1 eh_excind_trend all
12th power linear trend surface for all data in the Excavation Index.
2 eh_excind_trend englaid
12th power linear trend surface for EngLaID period data in the Excavation Index.
3 eh_excind_trend PR
12th power linear trend surface for unspecified prehistoric data in the Excavation Index.
4 eh_excind_trend BA
12th power linear trend surface for Bronze Age data in the Excavation Index.
5 eh_excind_trend IA
12th power linear trend surface for Iron Age data in the Excavation Index.
6 eh_excind_trend RO
12th power linear trend surface for Roman data in the Excavation Index.
7 eh_excind_trend EM
12th power linear trend surface for early medieval data in the Excavation Index.

So, what can we see from looking at these maps?  Overall, the Index shows greatest density of work in the south, particularly around Bristol, London and Kent.  For the EngLaID period as a whole, the pattern is similar, but with the area around Dorset becoming more important.  The unspecified prehistoric is biased towards London and Kent, but there are too few of these records to say that this is particularly meaningful.  The Bronze Age stands out as very distinct from all other periods, with clear peaks in Wessex, eastern Yorkshire and the Peak District: my assumption is that this represents particular research projects undertaken by EH.  The Iron Age shows peaks north of London and stretching down to Kent and towards Wessex.  The Roman trend is similar to the overall pattern for all periods, which is not surprising due to the high numbers of Roman records in the database.  The early medieval peaks around Hampshire, Kent and London, with greater emphasis also on East Anglia than the other periods.

Overall, most of these trends are fairly similar to those seen with previous datasets, at least when considered on a broad brush basis.  The major exception is for the Bronze Age, where the high trend surface peaks previously seen in south west England are no longer as dramatic.  London is also standing out more strongly in the Index than it had in most previous datasets, I think (although this is less pertinent when comparing with the NRHE, as we did not receive NRHE data for London).

Chris Green